
Mortgage reporting dashboards are interactive BI tools that consolidate data from your Loan Origination System, CRM, and core banking platforms into a single, real-time view of your entire lending operation. Unlike static monthly reports that confirm what already happened, dashboards surface problems while you still have time to act. They track origination volume, delinquency trends, compliance timelines, and loan officer productivity, all in one place, updating continuously rather than waiting for end-of-month exports.
The shift from reactive to proactive management is the core value here. When a loan stalls in underwriting or a delinquency rate climbs in a specific region, a well-built dashboard flags it the same day, not three weeks later in a PDF. Credit leaders who rely on these tools monitor metrics like FICO score distribution, loan-to-value ratios, TRID disclosure timelines, and HMDA data completeness across their full pipeline without pulling a single manual report.
Key data sources feeding these dashboards include:
- LOS platforms (pipeline status, milestone dates, loan conditions)
- CRM systems (lead source attribution, borrower communication history)
- Core banking or servicing platforms (payment history, delinquency data)
- Compliance tools (disclosure timing, audit trails, exception counts)
The payoff is faster, better-informed decisions at every level of the organization, from the loan officer managing a 40-file pipeline to the credit leader overseeing portfolio risk across multiple branches.

What types of reports and widgets do mortgage dashboards include?
Three dashboard types form the foundation of any mortgage BI environment: operational, strategic, and analytical. Getting the mix right is what separates a dashboard that actually gets used from one that collects dust.
Operational dashboards serve loan officers, processors, and operations managers who need a daily view of pipeline health. They show loans by status, highlight files stalled in underwriting, and flag lock expirations approaching in the next 7, 14, or 30 days. These are the dashboards people check every morning before their first call.
Strategic dashboards are built for executives and credit leaders. They summarize high-level KPIs: total funded volume versus target, pull-through rates by branch, cost to originate by channel, and month-over-month trend lines. The goal is a 60-second read of organizational health, not a deep dive.
Analytical dashboards give analysts and compliance officers the ability to dig into root causes. They support trend analysis, fair lending reviews, and HMDA field audits across the full pipeline.
Common widgets found across all three types include:
- Loan defect level indicators and responsible party reports
- Pipeline funnel visuals (Application → Processing → Underwriting → Clear to Close → Closed)
- Compliance tracking widgets for TRID and HMDA adherence
- Lock expiration exposure tables
- Drill-down cards linking a KPI to the individual loans behind it
- Alert banners triggered by threshold breaches (e.g., delinquency rate exceeds a set percentage)
- Role-based views that show each user only the data relevant to their function
Pro Tip: Set up role-based dashboard access from day one. A loan officer does not need to see branch-level profitability data, and an executive does not need a 200-row loan-level table. Scoped views reduce noise and increase adoption across your team.
Dashboards complement rather than replace static reports. Your compliance officer still needs a dated PDF for the audit file. The dashboard is what catches the problem before the audit.
What metrics and KPIs do mortgage dashboards track?
The metrics that matter most depend on your role, but a well-structured dashboard covers four categories: origination, processing, risk, and compliance. The table below maps the most common KPIs to their category and what each one tells you.

| KPI Category | Metric | What It Tells You |
|---|---|---|
| Origination | Loan volume by status | Overall pipeline size and production pace |
| Origination | Pull-through rate | Percentage of applications that reach funding |
| Processing | Average days per stage | Where loans slow down in your workflow |
| Processing | Lock expiration exposure | How many locks expire in the next 14–30 days |
| Risk | Delinquency rate | Percentage of active loans 30+ days past due |
| Risk | FICO score distribution | Credit quality concentration across the portfolio |
| Risk | Loan-to-value ratio | Collateral risk across loan products |
| Compliance | TRID disclosure timing | Whether Loan Estimates and Closing Disclosures meet CFPB deadlines |
| Compliance | HMDA data completeness | Missing or inconsistent fields before year-end reporting |
| Compliance | Fair lending indicators | Approval rate and pricing disparities across demographic groups |
| Performance | Loan officer productivity | Applications, closings, and pull-through rate per originator |
| Performance | Condition clearance velocity | How fast underwriting conditions are being cleared |
Core mortgage metrics tracked in production BI environments consistently include origination volume, pull-through rates, processing cycle times, delinquency rates, FICO distributions, loan-to-value ratios, and compliance timelines like TRID disclosures and HMDA data completeness.
A few of these deserve extra attention. Lock expiration exposure is a leading indicator, not a trailing one. Knowing that some loans have locks expiring soon gives your operations team something to act on today. Condition clearance velocity tells you whether your underwriting team is keeping pace or falling behind, before borrowers start calling to complain. These forward-looking metrics are what separate a real mortgage reporting tools overview from a backward-looking spreadsheet.
How do you interpret mortgage dashboard data effectively?
Reading a dashboard correctly is a skill, and most mortgage teams underinvest in it. The data is only as useful as the interpretation behind it.
Start with the 5-second rule: a well-designed dashboard should communicate its most critical message within five seconds of opening. If you cannot immediately spot the red flags, the dashboard is either poorly designed or overloaded with irrelevant information. When you open your pipeline health view and your eye goes straight to the loans stalled in underwriting for more than 15 days, that is good design working as intended.
Once you spot a warning sign, the next step is drilling down. Drill-down capability links a high-level KPI to the individual loans behind it, and that connection is what turns a red number into an actual conversation. A rising delinquency rate is a signal. Clicking through to see which loan product, which region, and which originator is driving it gives you something to act on.
Common interpretation pitfalls to avoid:
- Ignoring data quality issues. A dashboard built on inconsistent LOS data produces misleading visuals. Garbage in, garbage out.
- Overloading the view. Fifteen KPIs on one screen means none of them get the attention they deserve.
- Treating all metrics as equally urgent. Lock expiration exposure and HMDA completeness both matter, but they require different response timelines.
- Skipping cross-checks. If your pipeline dashboard shows a pull-through rate that seems unusually high, verify it against your LOS data before presenting it to leadership.
Pro Tip: Before trusting any dashboard metric for a major decision, trace it back to its source. Which LOS field is it pulling from? When did it last refresh? A dashboard that updated six hours ago may not reflect a loan that closed this morning.
Dashboards also support compliance monitoring in real time. Tracking TRID disclosure delivery dates against CFPB deadlines across your full pipeline, rather than spot-checking individual files, is the kind of visibility that prevents tolerance violations before they happen.
Five critical dashboards every credit leader needs
Credit leaders carry responsibility for loan quality, portfolio risk, and regulatory compliance simultaneously. These five dashboards address each of those responsibilities directly.
Pipeline health dashboard. This is the operational center of gravity. It shows every loan in the pipeline by status, flags files that have exceeded normal stage durations, and highlights lock expiration risk. A branch manager reviewing this dashboard each morning can redirect processor attention before a closing delay becomes a borrower complaint.
Delinquency and risk score analysis dashboard. Early detection is the entire point. Rather than waiting for month-end reports, this dashboard surfaces rising delinquency patterns by region, product type, and originator in near real time. When a specific loan product starts showing early payment behavior changes, you see it here first.
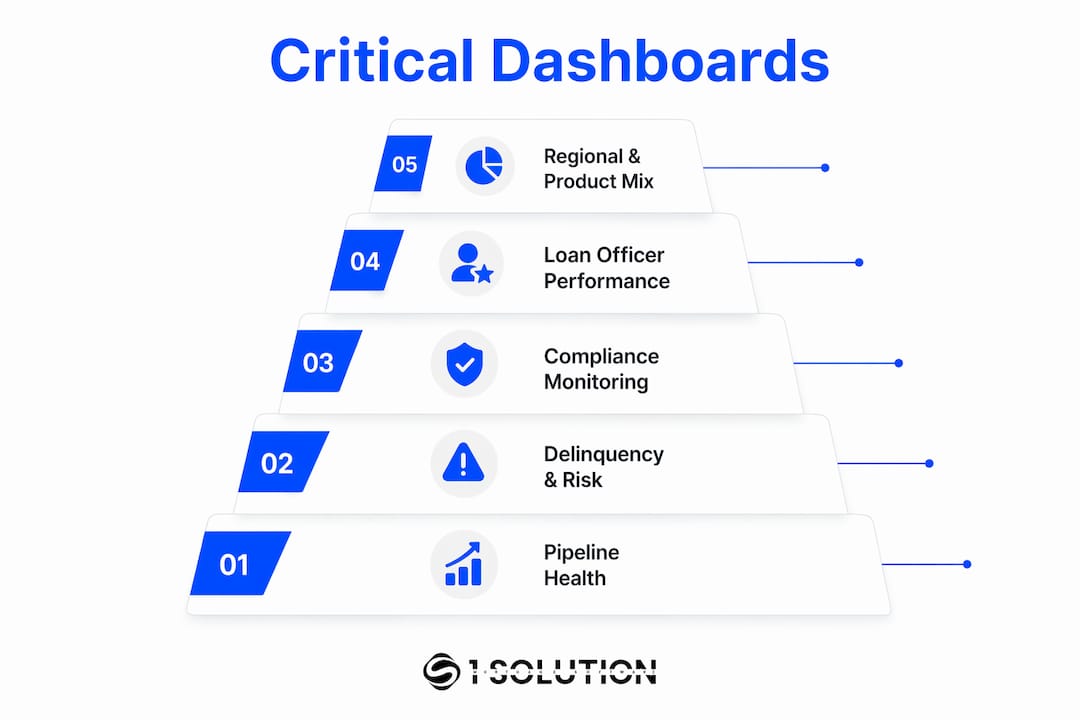
Compliance monitoring dashboard. Key operational dashboards for credit leaders include compliance views that track TRID and HMDA adherence across the full pipeline. Your compliance officer should review this weekly, not scramble through files at year-end. Fair lending visualizations that show approval rates and pricing across demographic groups belong here too.
Loan officer performance dashboard. This view tracks applications, closings, pull-through rates, and average days to close by originator. It is not about surveillance. It is about identifying who needs support, which loan officers are consistently closing fast, and where training or process changes would have the most impact.
Regional and product mix dashboard. Strategic planning requires knowing which markets and loan products are driving volume and which are underperforming. This dashboard supports decisions about staffing, marketing spend, and product strategy by making geographic and product-level trends visible at a glance.
Pro Tip: Build a weekly rhythm around these five dashboards. A 20-minute review of pipeline health, delinquency trends, and compliance status at the start of each week catches problems early and keeps your team aligned on priorities.
Real-world example: a compliance dashboard showing a backlog of overdue HMDA field reviews building across a branch gives the compliance officer a week to correct the data before it becomes a regulatory finding. Without that visibility, the same issue surfaces during an exam.
What do industry experts say about choosing and using mortgage dashboards?
The practitioners who have built and deployed mortgage BI environments consistently point to two factors that determine whether a dashboard program succeeds or fails: data quality and usability design.
"BI dashboards amplify data quality problems. If loan officers enter inconsistent data in the LOS, your dashboards will reflect that inconsistency. Address data quality at the source — LOS field validation, required fields, data entry standards — before trusting BI reports for decisions. Without governance, your BI environment becomes another source of conflicting numbers."
Source: Business Intelligence for Mortgage Companies
That point about governance is worth sitting with. A dashboard that shows two different pull-through rates depending on which workspace you open is worse than no dashboard at all. It erodes trust in the data and, eventually, in the team producing it.
On the build-versus-buy question, pre-configured mortgage data models and templates prevent months of custom development and accelerate deployment. Mortgage professionals who spend six months building a custom dashboard from scratch in a general-purpose BI tool often end up with something a pre-built mortgage template would have delivered in weeks.
Practical recommendations from experienced practitioners:
- Prioritize a single version of truth. Every dashboard in your environment should pull from the same data source with the same calculation logic. Conflicting numbers across reports destroy adoption.
- Match dashboard type to audience. Loan officers need operational views. Executives need strategic summaries. Analysts need drill-down access. Mixing all three into one screen serves nobody well.
- Embed dashboards into daily workflows. A dashboard nobody opens is not an asset. Schedule a standing team review, link the dashboard to your morning standup, or surface it inside your LOS platform so it is part of the natural work rhythm.
- Set refresh schedules that match urgency. Lock expiration exposure needs near-real-time data. A monthly cost-to-originate summary can refresh once a day. Matching refresh frequency to decision urgency keeps your system efficient.
- Name every dashboard by its audience and decision. "Pipeline overview" is too vague. "Branch manager weekly action list: loans at risk of lock expiration or closing delay" tells you exactly who uses it and what they do with it.
Balancing operational, strategic, and analytical dashboards within one BI environment is the best practice for meeting the varying needs of loan officers, credit managers, and executives at the same time. The goal is not one perfect dashboard. It is a layered system where each role sees exactly what they need to make their next decision.
Key Takeaways
Mortgage reporting dashboards transform raw lending data into real-time, role-specific intelligence that helps credit leaders catch problems early, stay compliant, and make faster decisions across origination, risk, and operations.
| Point | Details |
|---|---|
| Dashboards vs. static reports | Dashboards provide real-time decision support; static reports serve archival and compliance needs. Both are necessary. |
| Core KPI categories | Track origination volume, processing cycle times, delinquency rates, FICO distribution, and TRID/HMDA compliance timelines. |
| The 5-second rule | A well-designed dashboard communicates its most critical issue within five seconds of opening. |
| Data quality comes first | Poor LOS data produces misleading dashboard visuals; fix field validation and entry standards before deploying BI. |
| Role-based access matters | Loan officers, credit leaders, and executives each need scoped views to reduce noise and increase daily adoption. |
Why mortgage professionals cannot afford to operate without modern dashboards
Most mortgage teams are still making decisions based on data that is days or weeks old. That gap is where problems grow into crises.
Having spent over two decades working across mortgage operations as a processor, underwriter, loan originator, and systems consultant, I have seen what happens when a credit leader finds out about a delinquency trend at month-end instead of week one. The cost is not just financial. It is the scramble, the compliance exposure, and the erosion of confidence in the team's ability to manage risk.
The tools that actually work are not the ones built in boardrooms by people who have never touched a loan file. They are built by people who understand that a loan officer checking their pipeline at 7 AM needs to see five things clearly, not fifty things buried in tabs. That clarity is not a design preference. It is what determines whether the dashboard gets used or ignored.
What I have seen consistently is that mortgage professionals who invest in dashboards built on clean, integrated data from their LOS and CRM stop reacting and start leading. They catch the underwriting bottleneck before the borrower calls. They spot the HMDA field gap before the examiner does. They see which loan officer needs support before the pull-through rate drops.
The technology is not the hard part. The discipline of maintaining clean source data, building role-specific views, and embedding dashboards into daily workflows is where most operations either succeed or fall short. At 1 Solution Mortgage Software, we built our platform from that exact experience, integrating pricing, CRM, LOS, and compliance tools into one connected system so brokers have the data visibility they need without stitching together five different platforms.
Dashboards are not a luxury for large lenders. They are the operational foundation that independent mortgage professionals need to compete, stay compliant, and grow with confidence.